** Home
|
- New Jersey Climate and Weather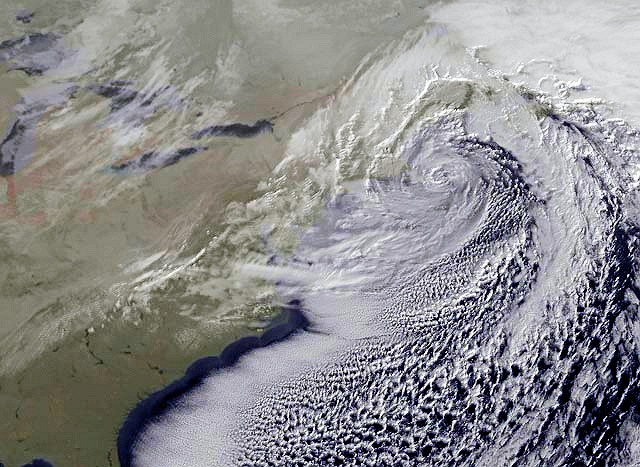 Northeast storm shown in satellite image off Atlantic Coast in December 2010. Image: National Aeronautics & Space Administration Northeast storm shown in satellite image off Atlantic Coast in December 2010. Image: National Aeronautics & Space Administration
-- Overview The climate of New Jersey is most influenced by its location in the continental path of wind circulation from west to east known as the "prevailing westerlies." New Jersey's coastal location also influences its temperatures, as the ocean's higher heat capacity than that of land maintains warmer temperatures along the Jersey Shore than in inland areas as temperatures cool during the fall and the first weeks of winter. In the spring and summer, ocean breezes often cool the beaches and adjacent inland. New Jersey's coastal location also makes it a frequent site for hurricanes and other tropical storms which form in the eastern Atlantic, and for nor'easters and other storms which are generated by temperature differences from warmer waters of the Gulf Stream coming into contact with cooler temperatures and wind systems closer to the coast. Annual temperatures in New Jersey have increased approximately 3°F since the beginning of the 20th century. Nine of the ten hottest calendar years on record for the state have occurred since 1990, with 2012 registering as the warmest year on record, at 4.5°F above average. The number of very hot days (daytime high temperatures above 95°F) has been above average since the early 2000s. Sea levels rose more than 8 inches at the Jersey Shore from 1979 to 2019, according to a report from Rutgers University, a trend expected to continue or worsen. Rainfall rates are up between 2.5 and 10% across the state since 1999, according to the New Jersey Department of Environmental Protection. The agency expects rainfall rates to rise 20% over the course of the century. Additionally, of the 70,000 New Jersey structures that were substantially damaged by Sandy, only about 9,000 have since been elevated above the flood water line, Moriarty said. For the thirty years through 2010, New Jersey was the 22nd highest state in its average annual temperature of 52.7 degrees Fahrenheit; Florida was the warmest state at 70.7 degrees and Alaska the coldest at 26.6 degrees. Since statewide records commenced in 1895, the highest temperature recorded in the state was 110 degrees on July 10, 1936 in Old Bridge; the lowest was -34 degrees on January 5, 1904 in River Vale. February of 2015, with an average temperature during the month of 22 degrees, was the third coldest February and tied as sixth coldest of any month. Colder months were the Januaries of 1918 (19.9), 1977 (20.2), and 1912 (21.9), with January 1940 equal to the 22 degrees of February 2015. The coolest year since records began in 1895 through 2015 was 1904, when the average temperature for the state was 47.8 degrees. The winter of 2014-2015 also was one of the snowiest on record; the 48 consecutive days with two inches or greater snow cover at New Brunswick was the 3rd longest on record since 1893 (maximum 53 in 2011). December of 2015 was the warmest December on record, with an average temperature throughout the state of 47.6 degrees--12 degrees above the normal average of 35.6 degrees for all Decembers from 1981 to 2010. For the entire 2015 year, the state's average temperature was 53.8 degrees, 2.4 degrees over the average of 51.4 degrees for the 20th century. The warmest year on record for the state since records began in 1895 was in 2012, when the average temperature was 55.9 degrees. For the thirty years through 2000, average annual precipitation for the state was 47.1 inches. The southeast coast in Atlantic and Cape May counties ranges from about 40 inches while north-central counties typically receive about 51 inches in north-central parts of the state. From 1981 to 2010, average annual snowfall amounts in Newark were 28.6 inches; in New Brunswick 28.4 inches; and in Cape May 14.9 inches. The number of days on which snowfall was recorded ranged from 14.5 days in Newark and Elizabeth to 0.6 in Moorestown. * Climate Change in New Jersey: Impacts and Responses, NJ Climate Change Resource Center, Rutgers University * National Centers for Environmental Information, National Oceanic and Atmospheric Administration * National Climatic Data Center, National Oceanic and Atmospheric Administration * Office of the New Jersey State Climatologist, Rutgers University * New Jersey Climate Overview, Office of the New Jersey State Climatologist, Rutgers University * New Jersey Weather & Climate Network * New Jersey Forecast, National Weather Service * The Average Climate of New Jersey, USA TODAY * New Jersey Climate Publications, Office of the New Jersey State Climatologist, Rutgers University |
|
Hurricane Sandy-
The storm causing the most property damage in New Jersey was Hurricane Sandy which made landfall on October 29, 2012 near Brigantine as a 1,000-mile-wide post-tropical cyclone, with an estimated sustained wind speed of 80 miles per hour. Although the wind speed was on the lower end of a Category 1 hurricane (a fact which lead some to call Sandy a 'Superstorm' rather than a 'Hurricane'), the storm coincided with a spring high tide that was higher than normal because of a full moon, resulting in a massive tidal surge that caused extensive flooding.  Roller coaster formerly on Seaside Heights boardwalk shown blown into surf during Hurricane Sandy. Image: Wikimedia Commons/NJ National Guard-US Air Force/Master Sergeant Mark Olsen Roller coaster formerly on Seaside Heights boardwalk shown blown into surf during Hurricane Sandy. Image: Wikimedia Commons/NJ National Guard-US Air Force/Master Sergeant Mark Olsen
Thirty-seven people died, 346,000 homes were damaged and two million households in the state lost power during the storm. In Mantoloking, all 521 houses were either damaged or destroyed and a 450-foot breach was opened in the land barrier normally separating the Barnegat Bay and the Atlantic Ocean. Total damage caused by Sandy in New Jersey and other states was estimated at $50 billion, more than any US hurricane except Katrina, which in 2005 caused over $100 billion in damage along the Gulf Coast and flooded extensive areas of New Orleans.
* List of New Jersey hurricanes, Wikiwand.com * National Hurricane Center, National Oceanic and Atmospheric Administration Blizzard of 1996-
Commencing on the evening of January 7, 1996, and continuing through much of the next day, New Jersey, along with other states from Kentucky to Maine, was struck by a blizzard with heavy snow and 5o mile-per-hour winds that created giant drifts. The storm shut down rail service; left thousands without electricity and heat for days; and closed most schools and government offices for a week. Snow fell at a rate of two inches an hour; some two feet was recorded in Bordentown, 27 inches at McGuire Air Force Base and 16 at Trenton.  Damage on Ocean City beachfront following Hurricane of 1944. Image: Wikimedia Commons/NJ State Police/James Brainerd Damage on Ocean City beachfront following Hurricane of 1944. Image: Wikimedia Commons/NJ State Police/James Brainerd
Great Atlantic Hurricane of 1944- In 1944, the "Great Atlantic Hurricane" came ashore near Atlantic City with nearly 100 mile-per-hour winds. Long Beach Island and Barnegat Island were both cut off from the mainland as the storm surge knocked out their connecting bridges. Many homes on Long Beach Island were swept out to sea and large sections of the boardwalks in Atlantic City, Ocean City and Asbury Park were destroyed. The Steel Pier and the Heinz Pier on the Atlantic City oceanfront both were extensively damaged, with the Heinz Pier later demolished and never rebuilt. Atlantic City resident recalls Hurricane of 1944
Great Blizzard of 1899- This February blizzard occurred during a highly unusual cold wave that impacted the East Coast as far south as Florida, with the temperature in Tallahassee plunging to -2 degrees--the only recorded instance of a sub-zero Fahrenheit temperature in that state. At Cape May, normally an area of New Jersey with relatively low snowfalls, the temperature dropped to a record 0 degrees and snow depths were measured as deep as 34 inches, the highest single storm snowfall total ever in New Jersey. Great Blizzard of 1888- The unusually late blizzard in the second week of March hit the East Coast when a warm, low-pressure system from the south collided with an arctic air mass coming down from the north. In the years before any reliable forecasts, there was little time for warnings as temperatures plunged from the 50s. The storm began with rain which soon changed to sleet and then heavy snow accompanied by strong winds, estimated at 60 miles per hour at Atlantic City, that lasted for nearly three days in New Jersey. Snowfall totals were not officially recorded until 1895, but anecdotal reports were that depths reached some 40 inches in the New Jersey-New York metro region and some 50 inches in Connecticut, with wind-driven drifts of several feet. Climate change New Jersey is viewed as particularly vulnerable to the impact of climate change influenced by global warming, a process caused by the emission of gases which absorb and emit radiation, thus trapping heat in the atmosphere. The primary greenhouse gases are water vapor, carbon dioxide, methane, nitrous oxide and ozone. The main sources of greenhouse gases due to human activity are burning of fossil fuels and deforestation leading to higher carbon dioxide concentrations in the air; agricultural activities, including the raising of livestock and the use of fertilizers that lead to, respectively, higher methane and nitrous oxide concentrations; and the use of chlorofluorocarbons in refrigeration, fire suppression and manufacturing processes. By mid-century, about 70% of summers in New Jersey will be warmer than the state’s warmest summer on record, according to one analysis.
Warmer temperatures are expected to result in rising sea levels and escalating inland tidal intrusions from melting of polar ice. Sea levels rose more than 8 inches at the Jersey Shore from 1979 to 2019, according to data from Rutgers University, a trend expected to continue or worsen. Rainfall rates are up between 2.5 and 10% across the state since 1999, according to the New Jersey Department of Environmental Protection. The agency expects rainfall rates to rise 20% over the course of the century. Both trends worsen flood risks statewide. Additionally, of the 70,000 New Jersey structures that were substantially damaged by Sandy, only about 9,000 have since been elevated above the flood water line. Since 1880, global sea level has risen by about 8 inches. Sea level has risen faster along the shores of New Jersey as compared to the global average. Waters along New Jersey’s coast are rising faster than the global average, with estimates for sea-level rise projecting an increase of 10 inches by 2030 and by 1.5 feet by 2050. With 10 inches of sea-level rise by 2050, the chance of extreme flood losses occurring will nearly double, with resulting destruction of or damage to infrastructure like sewage plants, water supply systems, roads and utilities. Observations beginning in 1911 show sea level has risen an average rate of 1.6 inches per decade over the period of record at Atlantic City, about double the global rate. Sea level rise has caused an increase in tidal floods associated with nuisance-level impacts. As the sea level has risen along the New Jersey coastline, the number of tidal flood days (the number of tidal flood days) has also increased, with the greatest number occurring in 2010 and 2012. Global sea level is projected to rise another 1 to 4 feet globally by 2100 as a result of both past and future greenhouse gas emissions from human activities In March 2016, a study was published on the impact of rising sea levels on the US coast projected that by the end of the century a six-foot sea level rise could force the relocation of over 837,000 New Jersey residents and a three-foot rise could result in forcing more than 300,000 from their residences. The most severe impacts, according to the report, would be on barrier islands in Ocean and Atlantic counties, but urban neighborhoods in low-lying areas of Hoboken and Newark also would be affected. Over the fifty years from 1963 through 2012, the sea level at Atlantic City rose 9.5 inches, according to a report by the Union of Concerned Scientists, with changes in the path and strength of ocean currents in the Atlantic also contributing to faster-than-average sea level rise. Storms are also projected to be more frequent and of greater intensity, with storm surges flooding both coastal areas and major cities. Barrier islands such as Long Beach Island are seen to be prone to inundation for long periods threatening the survival of the existing communities on the island. The temperature increases also will exacerbate health risks for the elderly, young children, minorities and lower-income groups, particularly those unable to afford housing with air conditioning. Other impacts will affect agriculture, with some crops and plants no longer viable, and tourism, as extreme heat reduces travel and visitor stays. In 2007, the state enacted the "Global Warming Response Act," which committed New Jersey to reduce global warming gases to 1990 levels by 2020, and to reduce greenhouse gas emissions to 80% below 2006 levels by 2050. The legislation also directed the Department of Environmental Protection to develop a 1990 greenhouse gas emission inventory and a system for monitoring current greenhouse gas levels. Companion legislation also established a fund for a cap-and-trade program for the exchange of credits for carbon dioxide generation. The 2007 laws also implemented the Regional Greenhouse Gas Initiative, a compact eventually including ten northeast and Mid-Atlantic states, including New Jersey, to cap and reduce carbon dioxide emissions by utilities and other major power generators and sources through a cap-and-trade program. In 2011, however, the Christie Administration announced that New Jersey was withdrawing from the RGGI and also indicated its lack of support for other programs intended to meet the targets set by the 2007 legislation.' After Governor Philip Murphy succeeded Governor Christie, the state re-committed to RGGI and in 2019 reauthorized and updated the 2007 legislation with additional, more directed mandates. In May 2018, Governor Murphy issued an executive order committing New Jersey to 100% clean energy by 2050. New Jersey has taken many steps toward achieving the 2050 goal but still remains short of of achieving its targets.. * New Jersey Climate Change Report 2021, National Oceanic & Atmospheric Administration * Global Greenhouse Emissions Data, US Environmental Protection Agency * How is New Jersey's Climate Changing and What Should We Expect, Office of the State Climatologist, Rutgers University * Sea Level Rise & Global Warming, Union of Concerned Scientists * An Unfamiliar State: Local Impacts of Global Warming in New Jersey, Environment New Jersey * "Rising seas could drive 837K N.J. residents from their homes, study says," 3/14/2016, NJ.com * Global Warming Current Status: Full Review, 2/19/2021, tomorrow.io |
|
|