-- Health - Status and comparisons
* Home
|
Health
* Status * Hospitals * Insurance/HMOs * Medical/Nursing schools * Consumer information * Economic impact * Health associations * Links * Health Images-Gallery -- Health status
Apart from the Pandemic of the COVID-19 crisis in 2020-22, the overall health status of New Jersey residents as compared to those of other states has been a special concern since 1973, when the National Cancer Institute published a cancer atlas showing extremely high levels of cancer in New Jersey-- with 19 of the state’s 21 counties ranking in the top 10% of all counties in the US in cancer death rates and particularly high rates along the New Jersey Turnpike corridor. The report led to the state being branded by one prominent academic researcher and the media as the site for "Cancer Alley," provoking understandable controversy over the basis for the findings. At the time, both the Institute and high-level state environmental officials attributed the cancer incidence to the number of petrochemical facilities in the area, but later analysts disputed the methodology of the report to the point where it was largely discredited.
Whatever the scientific merits of the NCI report, it provoked a political response which sparked a series of legislative and regulatory measures. Among other actions, the state initiated a comprehensive program to monitor the sites of toxic chemical production and storage; disclose the nature and risks of chemicals to workers at each site; track shipping of such substances through the state; establish a fund for cleanup of toxic spills and existing landfills; and create a statewide registry of cancer cases. New Jersey's aggressive program became the model for similar actions in other states, as well as for the federal Superfund program to identify and clean up toxic sites around the country.
The United States has the world's fifth highest cancer rate.at around 352.2 cases per 100,000 people. The most common type of cancer in the US is lung cancer, followed by prostate cancer and colorectal cancer. New Jersey cancer rates, which are the fifth highest of the states, with breast cancer leading among women and prostate cancer among men. Although incidence rates were high compared to other states, data also showed that death rates from cancer in New Jersey are lower than in many other parts of the country--a fact which some analysts attributed to patients having access to high quality care in the state and at nearby out-of-state cancer treatment centers. -- COVID-19 impact
In February 2020, New Jersey, along with other states and foreign nations, was forced to confront the coronavirus designated by the World Health Organization as COVID-19 which had originated in the city of Wuhan in China. As of June 2021, the states had a reported death count (including probable but not confirmed cases) of approximately 26,000 and total COVID cases of just under 1 million. Coronavirus Resources -- Comparisons with other states
On most other current measures of health status and behavior, New Jersey appears to rank either better or equal with its sister states. In a survey released in 2017, New Jersey ranked as the 12th-healthiest state in the nation (falling from 9th in the prior year), according to the annual state health rankings published by the United Health Foundation, an affiliate of the health insurer UnitedHealth Group. The top-ranked states were 1) Massachusetts 2) Hawaii, 3) Vermont, 4) Utah and 5) Connecticut. First released in 1990, the rankings are compiled based on death rates, disease incidence, health status and other factors. In its most recent report released April 2017, the nonprofit Leapfrog Group ranked New Jersey hospitals overall among the 50 states as 15th best in safety (infection rates, re-admissions, complaints etc.) based on the number of hospitals that earned the highest grade of 'A', an improvement from its 22nd rating in the prior year survey. Over the past 25 years, the state ranked among the top six states in improving its health status, rising from a low of 25th. The most progress, according to the report, was found in areas such as "smoking cessation, reducing the infant mortality rate and lowering the number of cardiovascular deaths.” Continuing concerns were identified as increasing rates of obesity (26.3% of adults in 2014 compared to 9.9% in 1990) and diabetes (9.2% in 2014, over twice the rate in 1996); relatively low rates of physical activity; high prevalence of low birth weight babies; high rates of preventable hospitalizations; and large disparities in health status by race and educational attainment. Within the state, wealth and socioeconomic status are the strongest indicators of health in a particular area. Hunterdon County--the wealthiest county in New Jersey--was the healthiest in the state for the eighth straight year, according to the annual analysis released in March 2017 co-sponsored by the Robert Wood Johnson Foundation and the University of Wisconsin Population Health Institute. Cumberland County--the poorest county with a poverty rate of 18%--also ranked as the least healthy in the state. * America's Health Rankings-New Jersey 2022, United Health Foundation * New Jersey State Health Assessment Data, New Jersey Department of Health * New Jersey State Cancer Registry, New Jersey Department of Health * The Dartmouth Atlas of Health Care * New Jersey Hospital Ratings, Leapfrog Group * Protecting New Jersey's Environment: From Cancer Alley to the New Garden State, Thomas Belton (2010) * How Disease Rates Vary by State--And What States Can Do About It, 12/12/2016, Stateline.org New Jersey Key Health Indicators 2021
(Centers for Disease Control and Prevention) Fertility Rate 58.0 (births per 1,000 women 15-44 years of age) Teen Birth Rate 7.9 (births per 1,000 females 15-19 years of age) Infant Mortality Rate 4.0 (infant deaths per 1,000 live births) Life Expectancy (at Birth) 77.5 years (2020) Marriage Rate 5.1 (marriages per 1,000) Divorce Rate 2.2 (divorces per 1,000) Leading Cause of Death Heart Disease Drug Overdose Death Rate 32.4 (per 100,000)¹ Firearm Injury Death Rate 5.2 (per 100,000)¹ Homicide Rate 4.8 (per 100,000)¹ - Highest State Cancer Rates -
| ||||||||||||||||||||||||||||||||||||||||||||||||||||||||||||||||
 The Margaret Hague Maternity Hospital in Jersey City, named after the mother of Mayor Frank Hague, was the site for the birth of over 350,000 babies from its opening in 1931 to its closing in 1979, including the births of former Governor James McGreevey, Martha Stewart and two of Frank Sinatra's children. Image: City of Jersey City The Margaret Hague Maternity Hospital in Jersey City, named after the mother of Mayor Frank Hague, was the site for the birth of over 350,000 babies from its opening in 1931 to its closing in 1979, including the births of former Governor James McGreevey, Martha Stewart and two of Frank Sinatra's children. Image: City of Jersey City
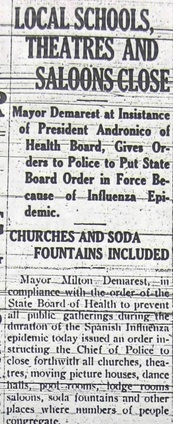
-- Life expectancy Life expectancy for those born in New Jersey during 2022 was 80.2 years, above the national average of 77 years. In 2018, among the 50 states and D.C., Hawaii ranked first as having the highest life expectancy for the total population, with a life expectancy at birth of 81.0 years; New Jersey ranked ninth with 79.8 years. The ten states with the longest life expectancies as of 2023 are: Hawaii (81.5), California (80.8), Minnesota (80.8), New York (80.7), Connecticut (80.6), New Jersey (80.4), Colorado (80.0), Washington (80.0), Massachusetts (79.0), and Vermont (79.0). -- Births Since the early 1990s, the birth rate among New Jersey residents has followed the same trend as that of the nation as a whole while always remaining below the US birth rate. Over half the births among New Jersey mothers are to those aged 25 through 34 years old. Since 1987, there have been more births to women aged 35 and over than to those under age 20. The median age of all mothers peaked in 2003-2004 at 30.5 years but the median age among first time mothers reached a high point of 28 years in 2011. For all births, the median age among African American and Hispanic mothers is about four years younger than among white and Asian/Pacific Islander mothers. For first births, the median age among African American and Hispanic mothers is about seven years younger than among white and Asian/Pacific Islander mothers.  New Jersey deaths in the 1918-1919 global Spanish flu pandemic were estimated to approach 5,000 of the 650,000 who died across the US. This article describes actions by the mayor of Hackensack to comply with order closing public gathering places of the State Board of Health. Image: Bergen Evening Record October 8, 1918 from www.hackensackschools.org New Jersey deaths in the 1918-1919 global Spanish flu pandemic were estimated to approach 5,000 of the 650,000 who died across the US. This article describes actions by the mayor of Hackensack to comply with order closing public gathering places of the State Board of Health. Image: Bergen Evening Record October 8, 1918 from www.hackensackschools.org
-- Deaths
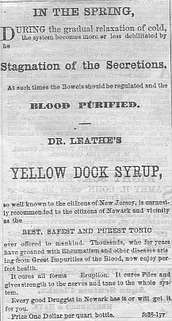
In 2022, there were 79,835 deaths reported in New Jersey, with the average age at death of 75.1 years. In 2022, heart disease (17,401 deaths), cancer (14,554) and influenza/pneumonia (14,471) were the leading causes of death in the state based on state health data. Although heart disease and cancer have traditionally been the leading causes of death in New Jersey, accounting together for about half of all deaths each year, the COVID-19 Pandemic, which first began to spread in the state in 2020, has led to a spike in respiratory related deaths such as influenza and pneumonia. For 2018, the American Cancer Society estimated that there would be 16,040 deaths from cancer during the year in New Jersey. Over the 2008-2012 period, the average annual deaths resulting from cancer was 16,684, and both New Jersey men and women had higher incidence rates compared to the US for the most common cancers with some exceptions, such as for lung and colorectal cancer. The leading deaths by cancer types in 2018 were projected to be lung and bronchus (3,670); colon and rectum (1,400); female breast (1,250); prostate (750); and pancreas (700). Behind heart disease and cancer, stroke, chronic lower respiratory diseases, unintentional injury, diabetes, Alzheimer's disease, septicemia, kidney disease, and influenza/pneumonia constitute the remainder of the ten leading causes of death for New Jersey. Suicide is the tenth leading cause of death in the US, but ranks 13th in New Jersey. * National Center for Health Statistics, Centers for Disease Control and Prevention * Life Expectancy at Birth by State, Kaiser Family Foundation * Cancer Facts & Figures 2018, American Cancer Society * New Jersey State Cancer Registry, New Jersey Department of Health  Ad published in Newark Daily Advertiser in 1861 typical of the many cures promoted for various ailments during the period. Image: NewJerseyAlmanac.com Ad published in Newark Daily Advertiser in 1861 typical of the many cures promoted for various ailments during the period. Image: NewJerseyAlmanac.com
-- Communicable Disease
Prior to the COVID-19 Pandemic of 2020-22, sexually transmitted diseases ("STDs") were the most common form of communicable disease with 52,000 cases reported in the state in 2017, according to data released annually by the state Department of Health. (The state statistics only cover diseases required to be reported to the Department, excluding such frequent illnesses as the common cold and other diseases). Influenza ranked second with over 13,000 cases of various strains. Hepatitis C, a blood-borne illness affecting the liver, had some 7,500 cases reported in 2017. For primarily childhood diseases, there were a reported 480 cases of chicken pox; 41 of mumps; and 3 of measles. No cases of polio were reported. Of the diseases which historically were causes of major epidemics and thousands of deaths in New Jersey, in 2017 there were no reported cases of smallpox, yellow fever or diphtheria and only four cases of cholera. * Infectious and Communicable Diseases, New Jersey State Health Assessment Data, New Jersey Department of Health |