|
* Home
* History * Population * Government * Politics * Lobbyists * Taxes * State Symbols * Biographies * Economy * Employers * Real Estate * Education * Recreation * Restaurants * Hotels * Health * Environment * Stadiums/Teams * Theaters * Historic Villages * Historic homes * Battlefields/Military * Lighthouses * Art Museums * History Museums * Wildlife * Climate * Zoos/Aquariums * Beaches * National Parks * State Parks * Amusement Parks * Waterparks * Swimming holes * Arboretums More... * Gallery of images and videos * Fast Facts on key topics * Timeline of dates and events * Anthology of quotes, comments and jokes * Links to other resources |
- New Jersey Population - Overview--Total population
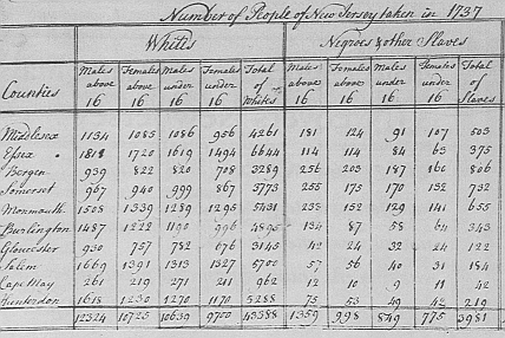
The 2020 United States census reported hat the population of New Jersey was 9,288,994 on April 1, 2020, a 5.7% increase since the 2010 census, according to the US Census Bureau. The Census Bureau counted 9,288,994 people living in New Jersey as of April 1, 2020 and another 5,499 mostly military and their family members from the state living overseas, for a total of 9,294,493 used to apportion seats in the House of Representatives. New Jersey’s official count represents an increase of 4.5%, or about 398,000, higher than the bureau’s estimate of the state’s 2020 population. The state ranked as the eleventh most populous state in the 2020 Census, behind #10 Michigan at 9.97 million and ahead of #12 Virginia at 8.87 million. In 1900, the state population was 1,884,000.. In the first national census in 1790, New Jersey was reported to have 184,139 citizens, a population density of about 25 persons per square mile compared to the 1,210 persons in the 2020 Census--the highest density of all states. It is the fourth smallest state in land area (behind only Rhode Island, Delaware and Connecticut), * US Census Bureau * New Jersey QuickFacts, US Census Bureau --Race The 2019 Vintage Year Census data reported the following estimates: 71.9% White alone, 15.1% Black or African American alone, 10.0% Asian alone, 0.6% American Indian and Alaska Native alone, 0.1% Native Hawaiian and Other Pacific Islander alone, and 2.3% Two or more races. Hispanic or Latino accounted for 20.9%, while White alone (non Hispanic or Latino) accounted for 54.6% of the population. From 2010 to 2019, the Hispanic and Asian populations of the state each rose by nearly 20%, adding more than 425,000 people. Hispanics now account for 1.86 million of the state’s residents, or one of every five, after growing by 292,000 over the decade, according to Census estimates. The statewide diversity index, which measures the likelihood that any two residents will identify as a different race and ethnicity combination, grew from 59.4% to 65.8%. The total population identifying as white, 55%, dropped below that of neighboring New York. Middlesex County now ranks first on the state's diversity index — placing it in the top 20 counties in the nation. The county had nearly 66,000 more people identify as white in 2010, when the population was about 63,000 less, records show. * Current Population Survey, US Census Bureau --Foreign immigration and national origins Over the more recent decades, New Jersey has depended on foreign immigration to avoid a net decline in population. The primary sources of foreign immigration to New Jersey have increasingly been shifting from Europe to Latin America and Asia. According to data from the National Science Foundation, immigrants comprise 48% of state residents with master’s degrees and 41% of those with doctorates in scientific fields. In 2018, it is estimated that New Jersey had 425,000 unauthorized foreign immigrants, with the largest numbers from Mexico (87,000); India (48,000), the Dominican Republic (31,000), Guatemala (31,000), and El Salvador (30,000). * Current Population Survey, US Census Bureau * State Immigration Data Profiles, Migration Policy Institute |
|
--State-to-state migration In 2020, the annual survey published by United Van Lines reported that of all states New Jersey had the largest outbound movers at 70%, with the state hoding the highest outbound spot for 3 consecutive years. Throughout the COVID-19 pandemic in 2020, major metropolitan areas and hotspots, such as New York City (72%), Newark (72%) and Chicago (69%), experienced greater outbound migration, while lower-density cities like Wilmington, North Carolina (79%) and Boise, Idaho (75%) saw high levels of inbound moves. * 2020 Annual National Movers Study, United Van Lines * Statistics of Income, Migration Data 2015-2016, Internal Revenue Service --Age
The 2020 census found nearly 7.3 million residents as adults over 18 years old, 78.4% of the total population, an increase from the 2010 share of 76.5%. The median age of New Jersey's population in the 2010 Census was 39 years, the 41st oldest of the states behind Utah, the youngest at 29.7 years, and ahead of Maine, the oldest at 42.7 years. The state had an estimated 14.7% of its population 65 years or older as of 2014 compared to the national average of 14.5% according to the Census Bureau. Some 40% of the state's 18 to 34 year-olds live with their parents, a proportion well above the national average of 30%. * New Jersey Quick Facts, US Census Bureau --Counties
In the 2020 Census, Bergen County, the state's largest county with a population in 2020 of 955,732, grew by more than 5%, Essex County grew by more than 10% and Hudson added more than 14% to its population. Cape May, Salem and Sussex declined by more than 2% between 2010 and 2020. Hunterdon and Atlantic counties also slightly declined in population. * New Jersey State and County QuickFacts, US Census Bureau --Cities
Only four cities in New Jersey have a population over 100,000 people. Both of the state's largest cities, Jersey City and Newark, saw their populations increase by more than 10% between the 2010 and 2020 censuses. The third-largest, Paterson, grew by 9%. Among towns with significant growth, Lakewood grew from fewer than 93,000 people in the 2010 census to over 135,000 in 2020. -- Religion
New Jersey's religious composition was 67% Christian; 14% non-Christian; and 18% unaffiliated (atheist; agnostic; nothing or don't know), according to the 2014 Religious Landscape Study of the Pew Research Center. Among Christians, 34% are Catholic and the overall the state has the highest proportion of Catholics at 38%, second only to Rhode Island's 44%, according to the American Values Atlas. The New Jersey Jewish population of 516,470 is 5.8% of its 2014 population (second highest after New York state). It has the second largest percentage of Muslims in its population of .9% (after Michigan). With 109 mosques in 2011, it tied with Illinois for the fifth highest number of all states, behind first-ranking New York with 257. The city of Paterson was estimated to have 25,000 to 30,000 Muslims as of 2011. * Religious Landscape Study, Pew Research Center * Jewish Virtual Library * Distribution of Muslim Population in the United States, 2010, Muslim Journeys, National Endowment for the Humanities -- Marriage and divorce Some 53% of males and 48% of females aged 15 and older in New Jersey were married compared to, respectively, 52% and 48% nationally, according to a survey for 2007-2008 taken by the US Census Bureau. The median age at first marriage in New Jersey was 30 years old for men--tied for highest of all states--and 28 years for women, compared to the US average of 28 years for men and 26 for women. Those currently divorced at the time of the 2007-2008 survey comprised 7% of men and 10% of women compared to 9% and 12%, respectively, for all states. * Marriage and Divorce, American Community Survey, US Census Bureau * Marriage and Divorce, National Center for Health Statistics/Centers for Disease Control * The States of Marriage and Divorce, Pew Research Center --Projections
Population growth is projected to average 0.6% annually from 2014 to 2025, compared to 0.8% for the nation as a whole, with the state's share of total US population expected to fall from 2.8% in 2014 to 2.6% in 2045. By 2045, the state's total population is projected to be just over 10 million residents. The population is expected to include more seniors, Hispanics and Asians by 2020. The smallest racial groups in the state, Native Americans, Pacific Islanders and Multiracial populations, are projected to increase substantially, growing by 167% between 2010 and 2030. By 2025, it is projected that non-Hispanic whites will no longer be a majority of New Jersey's population, accounting for just 49.4% of the total population by then * New Jersey Quick Facts, US Census Bureau
* Statistics of Income, Migration Data 2015-2016, Internal Revenue Service -- Quality of life
According to a survey released in March 2023 by the Monmouth University Polling Institute, more than 6 in 10 New Jerseyans say the state is either an excellent (18%) or good (45%) place to live, while 25% say it is only fair and 12% rate the state as poor. The current positive rating of 63% is just below 64% in 2022 and above 59% in 2021. This number hit 68% in 2020, during the early days of the pandemic. The all-time high mark for the state as a place to live rating was 84% positive in February 1987. The record low was 50% in February 2019, but it improved to 61% by September of that year. * New Jersey Quality of Life Index, Monmouth University Polling Institute, 3/2/2023 |

