​
  • NewJerseyAlmanac.com: Gateway to New Jersey Information
    • Government-Overview
    • Law firms
    • About
    • History >
      • Native Americans
      • Employers >
        • Royal Governance
      • Exploration and Settlement
      • British Colonial Period
      • Path to Revolution
      • Revolutionary War
      • 19th Century Industrial Development
      • Civil War
      • Post-War Economy & Reform
      • Election of Woodrow Wilson
      • World War I and 1920s
      • Great Depression and 1930s
      • 1930s; Prelude to War, Lindbergh, Hindenburgh & War of the Worlds
      • World War II
      • Post-War Suburbanization
      • 1970s & 1980s--Income tax, Brendan Byrne and Thomas Kean
      • 1960s and Richard Hughes
      • 1990s--Florio & Whitman
      • 9/11 & McGreevey Administration
      • Codey & Corzine >
        • Transportation-History Air >
          • Transportation-History World War II-2000s >
            • News
          • Fast Facts >
            • Contact
            • New Jersey Product Store
          • E-books
      • Chris Christie
      • Phil Murphy
  • Environment
    • New Jersey Hospitals: Essex-Middlesex Counties
    • Environment--Solid Waste >
      • Health-Status and Comparisons >
        • Health--New Jersey Hospitals: Atlantic-Gloucester
        • Marijuana
        • Links-Hospitals
        • Health-Insurance/HMOs
        • Law Schools
        • Health--Hospitals >
          • Higher Education-Directory >
            • New Jersey Hospitals: Salem-Warren Counties
        • Health--Medical and Nursing Schools
        • Education
        • Health-Consumer information >
          • Media >
            • Biographies >
              • Biographies S-Z
              • Biographies N-R
              • Biographies E-G
              • Biographies H-M
          • Health--Economic Impact
      • Environment--Waste Disposal History
      • Environment-Air
    • Wildlife
    • Environment-Water >
      • Labor Unions: Overview >
        • Labor Movement History
    • Gallery-Labor & Industry >
      • Health-New Jersey Hospitals Monmouth-Passaic
    • Climate
  • Links
    • Gallery
    • Gallery-Videos: History
    • Gallery-Health
    • Gallery--Wildlife
    • Gallery- Battles/Military
    • Gallery-Settlement-1799 >
      • Gallery-Labor & Industry
      • Gallery-Politics
      • Gallery-Hudson County >
        • Gallery 1800-1899 >
          • Gallery 1900-
          • Gallery-Videos: Places >
            • Best Golf Courses in New Jersey
            • Advertising & Sponsorships
          • DataBank-Population
      • Gallery-Newark
      • Gallery-Trenton
      • Gallery-Jersey Shore
      • New Jersey Book Store >
        • Population
        • Timeline >
          • New Jersey Anthology
        • New Jersey Timeline - Prehistoric-1699
        • New Jersey Timeline 1950-1999 >
          • New Jersey Timeline 1850-1899
        • New Jersey Timeline 1700-1749
        • New Jersey Timeline 1850-1899
        • New Jersey Timeline 1800-1849 >
          • Geology
        • New Jersey Timeline 1900-1949
        • New Jersey Timeline 2000- >
          • New Jersey Timeline 1750-1799
        • Labor Union Profiles
      • Gallery-Princeton
  • Hotels/Lodging
  • Restaurants
  • Recreation
  • Insurance
  • New Jersey Government--Governor & Executive
  • Government--Legislature
  • Congressional Delegation
  • Historic Villages & Towns
  • New Jersey Sports Stadiums & Teams
  • New Jersey Theaters
    • Theaters--South Jersey
  • Museums-Art
  • Museums-History
  • Zoos/Aquariums
  • Amusement Parks
    • Amusement Parks-Profiles
  • Jersey Shore Guide & 2024 Beach Fees
    • Jersey Shore Guide & 2024 Beach Fees - M-Z
  • Waterparks
  • Swiming holes, lakes & natural pools
  • Arboretums/Gardens
  • Symbols
  • State Parks
    • Equestrian Centers/Riding-South Jersey
  • National Parks
  • Equestrian Centers/Riding
  • Equestrian Centers/Riding-Central NJ
  • NJ Government Services
    • Government--Lobbyists
    • Transportation-Rail and Bus Transit >
      • Economy: Overview
    • Real Estate >
      • Transportation-Air
    • Population-Current Overview
  • Transportation-Overview
    • New Jersey Municipalities >
      • Taxes
      • Transportation-Roads
      • Transportation-Links
      • New Jersey Courts
      • Legal practice-Overview
      • Links-Law
    • Growth Companies
    • Population-Overview >
      • Population-Historical overview
    • Transportation-History
    • New Jersey Counties
    • Political History
    • Venture Capital
    • Elections and Politics
  • Equestrian Centers-Equine Rescue
    • Equestrian Centers-Resources/Links
  • Equestrian Centers-Therapeutic/Special Needs
  • Equestrian Centers-Racing
  • Associations-Business
    • Associations-Legal
    • Associations-Real Estate
    • Associations-Environment/Natural Resources
    • Associations-Social Welfare
    • Associations-Public Safety
    • Associations-Health
  • New Jersey Presidential Quiz
  • Kean University
  • College of New Jersey
  • New Jersey Institute of Technology
  • Montclair State University
  • Rutgers University
  • New Jersey City University
  • William Paterson University of New Jersey
  • Rowan University
  • Ramapo College of New Jersey
  • Thomas Edison State University of New Jersey
  • Stockton University
  • Opinion
  • Opinion-An Appreciation of Brendan Byrne
  • Links
  • New Jersey Social Media Links
  • Media/Opinion/Blogs
  • Adult Education
  • Shopping Outlets
  • Foundations
  • Shopping Malls
  • Best NJ Shops
  • Best NJ Food Shops
  • New Jersey History Timeline - January
  • New Jersey History Timeline - February
  • New Jersey History Timeline - March
  • New Jersey History Timeline - April
  • New Jersey History Timeline - May
    • New Jersey History Timeline - June
    • New Jersey History Timeline - June
  • New Jersey History Timeline - July
  • New Jersey History Timeline - August
  • New Jersey History Timeline - July
    • New Jersey History Timeline - September
    • New Jersey History Timeline-October
  • New Jersey History Timeline-October
  • New Jersey History Timeline - November
  • New Jersey History Timeline - December
    • New Jersey History Timeline - December
  • Opinion-On the Passing of Brendan Byrne
  • Casino-Hotels
  • NJ Online Casinos
  • Sports Gambling
  • Lottery
  • Clifford Goldman Dies
  • NJ Sexual Abuse Resources
  • Movies, TV set in NJ
  • Princeton University
  • Bloomfield College
  • Caldwell University
  • Centenary University
  • College of Saint Elizabeth
  • Drew University
  • Fairleigh Dickinson University
  • Felician University
  • Georgian Court University
  • Monmouth University
  • Rider University
  • Saint Peters University
  • Seton Hall University
  • Stevens Institute of Technology
  • Princeton University History Timeline
  • New Jersey Day Trips
  • New Jersey Day Trips - Liberty Park
  • New Jersey Day Trips - Camden
  • New Jersey Day Trips - Asbury Park
  • Day Trip - Ocean Grove
  • Opinion-Remembering Jerry O'Connor
  • Real Estate as a Side Hustle
  • Most Picturesque Places in New Jersey
  • starting a business
  • Operating a Business
  • New Jersey Geology
  • Financing a Business
  • Mental Health Resources in New Jersey
  • New Jersey Disasters
  • Pillar College
  • Charities- Overview
    • Leading Companies
    • Charities- Cardiac/Cancer/Diabetes
    • Charities-Addiction
  • Finding a New Jersey Job
  • Filing a Complaint
  • Hiring a Lawyer in New Jersey
  • Buying a Home
  • Doing Good
  • State Government Departments & Ages
  • Casino Gambling in Atlantic City
  • Cannabis in New Jersey
  • Where Will the Next New Jersey Sports Championships Come From?
  • Meeting People
  • Movies & Television
  • Novels Set in New Jersey
  • Senior Citizen Resources in New Jersey
  • Year-on-Year New Jersey Gambling Figures Increasing
  • Deaths: Probating a Will in New Jersey
  • Religion in New Jersey
  • Judaism in New Jersey
  • Christianity in New Jersey
  • bio
  • Television
NewJerseyAlmanac.com

                                      -- Population - Overview

*  Home
*  History
*  Population
*  Government
*  Politics
*  Lobbyists 
*
  Taxes
*  State Symbols
*  Biographies
*  Economy
*  Employers
*
  Real Estate
*  Education
*  Recreation
*  Restaurants 
*  Hotels  
*  Health 
*  Environment​

*  Stadiums/Teams
*  Theaters 
*  Historic Villages

*  Historic homes 
*  Battlefields/Military 
*  Lighthouses 
*  Art Museums 
*  History Museums 
*  Wildlife 
​*  Climate  
*  Zoos/Aquariums
*  Beaches 
*  National Parks 
*  State Parks 
*  Amusement Parks
 
*  Waterparks 
*  Swimming holes 
*  Arboretums  

More...
*  
Gallery of images and videos
*  
Fast Facts on key topics
*  Timeline of dates and events
*
   Anthology of quotes, comments and jokes
*  
Links
to other resources
Picture
New Jersey Orange & Yellow
drawstring bag

​15.5″ W by 19.5″ H
$30

Population
*  Overview  * 
History  ​*  Databank
Picture
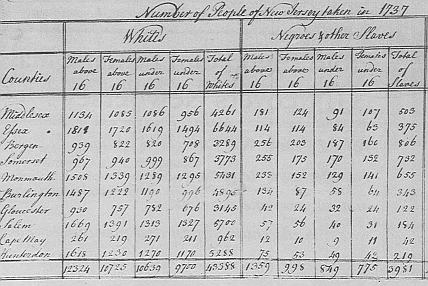
1737 census of the colony. Image: New Jersey State Archives
 
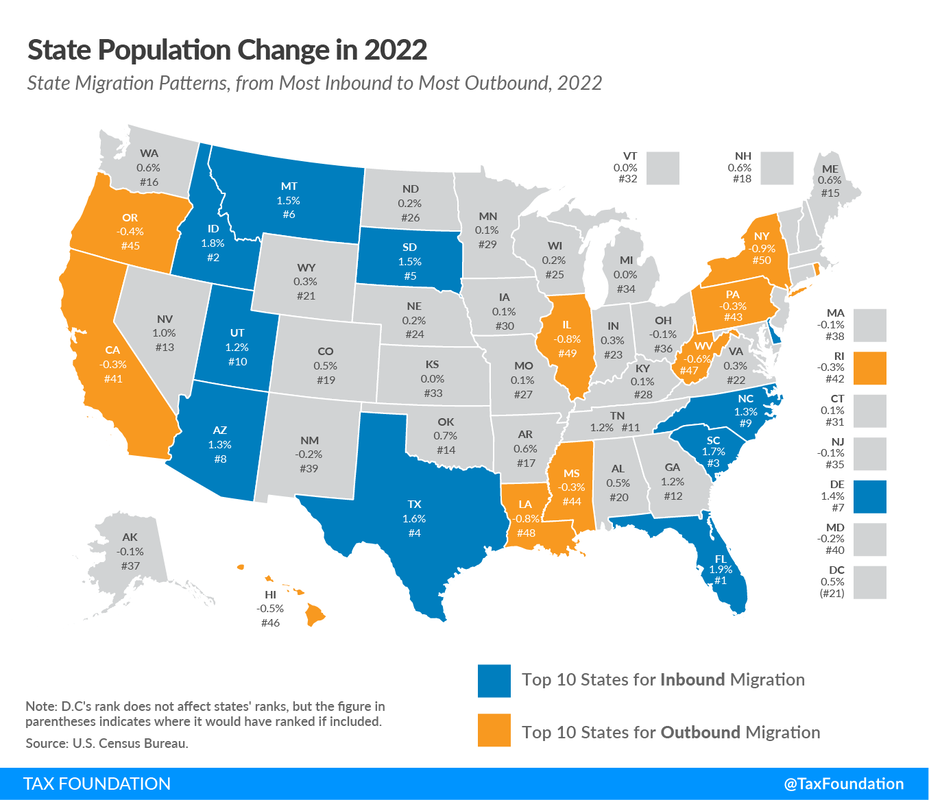
--Total population   

       
The US Census Bureau reported that the population of New Jersey was 9,288,994 people living in the state as of April 1, 2020, an increase of 5.7% from  the 8,791,894 in the 2010 census. Accordng to annual estimates by the Census Bureau, from July 2023 to July 2024, New Jersey had a net population gain of 121,209, the Bureau reported the fastest growth rate in the Northeast, primarily due to the state gaining 130,692 international immigrants. The state has the 11th highest overall population nationwide, but the fifth-most international immigrants. New Jersey had 101,199 births and 75,189 deaths, for a net population gain of 26,010, but its birth rate isn't high enough in future years to replace deaths of the aging baby boomer population.

Domestic migration. New Jersey had a net loss of 35,554 as residents left the state for new jobs, lower costs or warmer weather. The three most popular destinations, according to Census data: Pennsylvania, New York and Florida.
​       
       As the fourth smallest state in land area (behind only Rhode Island, Delaware and Connecticut), New Jersey has the highest population density of all states. Its total land mass equates to 8,721 square miles (22,608 square kilometers)  For every square mile of territory, there is an average of 1,195.5 people, which makes it the most densely populated state in the US. New Jersey is the only state to have every single county considered "urban" by the Census Bureau.

       Growth between 2010 and 2020 was most concentrated in Hudson and Essex counties. Ocean County's rise was driven by Lakewood’s highest-in-the-state population increase of 46%. Newark broke the 300,000-population threshold for the first time in decades, maintaining its spot as the state’s most populous municipality with 281,917, ahead of second highest Jersey City with 262,652.

       Among all states between 2010 and 2020, Texas had the largest numeric increase in population, gaining 4 million people since 2010. Florida, California, and Georgia all gained at least 1 million in population (increases of 2.7 million, 2.3 million, and 1 million, respectively). Eight additional states (Washington, North Carolina, New York, Arizona, Colorado, Virginia, Tennessee, and Utah) gained at least 500,000 people. Utah was the fastest-growing state over the decade with an 18.4% increase. West Virginia’s decline of 59,000 between 2010 and 2020 was the largest loss of any state. Illinois (down 18,000) and Mississippi (down 6,000) also had population declines for the decade. Puerto Rico’s population declined by 440,000 or 11.8%. 

       Between 2020 and 2024, the Census Bureau estimates that New Jersey led the Northeast in year-over-year population growth rate with the number of residents climbing to an estimated 9,500,851, representing an increase of 1.3% or 121,209 from 2023 and a 2.3% population increase — or 211,837 new residents — since April 2020.

       New Jersey ranked as the sixth most diverse state in the nation, moving up two places since 2010 in the census diversity ranking. 

*  Census Brief: Warmer, older, more diverse: State-by-state population changes to 2025, US Census Bureau
*  2020 Census Statistics Highlight Local Population Changes and Nation’s Racial and Ethnic Diversity, US Census Bureau
​
*  State Population Estimates Totals: 2020-2024, US Census Bureau
*   NJ grows, and it grows more diverse, NJSpotlight.com, 8/13/2021 
*  Estimates of Resident Population by Age & Sex, NJ: 1990-1999
*  See how and where New Jersey changed, NJSpotlight.com

  • Median Household Income: The median household income in New Jersey is $99,781.
  • Education: About 43.8% of New Jersey residents aged 25 and older have a bachelor's degree or higher.
  • Age: The median age in New Jersey is 40.4 years.
  • Ethnicity: Approximately 33.3% of New Jersey residents speak a language other than English at home.
  • Healthcare: Around 7.2% of New Jersey residents under the age of 65 do not have health care coverage.
  • Housing: New Jersey has about 3,761,229 housing units.
Race
Population 
Percentage 
White
​5,820,14765
​50%
Black or African American 
1,189,681
13.39%
Asian 
844,105
9.42%
Some other race
564,662
​6.35%
Two or more races 
427,61
​4.81%
American Indian and Alaska Native
22,288 ​
​0.25%
Native Hawaiian and Other Pacific Islander
​3,156
0 .04%
US Census 1790
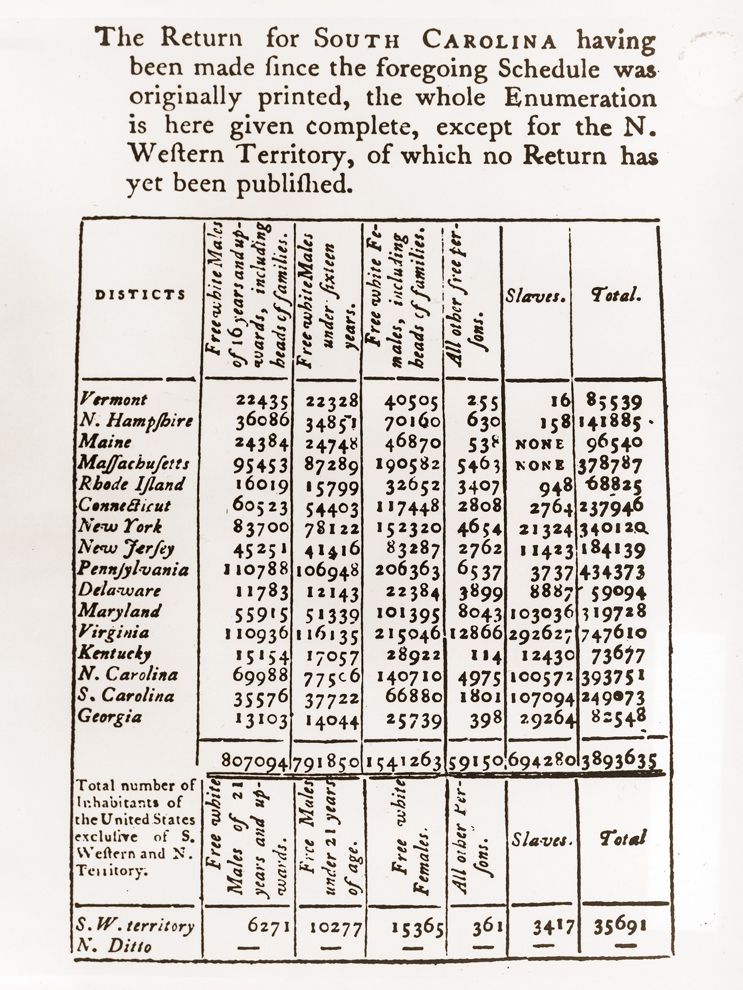
1790 US Census. Image: US Census Bureau/National Geographic Society
 
​--Race and Ethnicity

       
        A new Census Bureau report released in September 2023 provides a more detailed profile of the diversity of the state's population:

       Italians comprise the biggest demographic of “white-alone” residents, with 608,791 people representing nearly 12% of white-alone New Jerseyans identifying as Italian. Italians also are the bulk of white-alone residents in the nearby states of New York, Connecticut, and Rhode Island, while most other states list English or German as their biggest white-alone populations.

       The largest share of Blacks in New Jersey and every other state identifies as African-American. Haitian, Jamaican, Nigerian, and Ethiopian were the next largest groups of Black people. More than 41% of the Asian population, or 432,883 people, identifies as Indian. Other states report that Indian, Chinese, Filipino, Hmong, and Vietnamese are their largest Asian populations. Puerto Ricans comprise the largest share of New Jersey’s Latino/Hispanic population, accounting for 459,270 people, or 23% of that population. Neighboring states New York, Pennsylvania, and Connecticut also report Puerto Ricans as the biggest group of Latinos, while people identifying as Mexican dominate the Latino populations in most other states nationally. Brazilians are the most prominent “other race,” accounting for 42,773 people, or 2.5% of New Jersey residents of other races.

      Whites remained the majority of the state’s 9.29 million residents — 52% in 2020 according to the Census Bureau. Most of the growth between the 2010 and 2020 counts, however, was among Hispanics and Asians: The number of people identifying as Latino rose by almost 29%, with the number of Asians growing by 31%. Among those identified as Asians, 369,590 are Asian Indians, 158,076 are Chinese, 115,958 are Filipinos, 13,245 are Japanese, 96,644 are Korean, 22,594 are Vietnamese and 67,998 are other Asian nationals. More than two of every 10 New Jerseyans were Hispanic and one in 10 were Asian. New Jersey ranked as the sixth most diverse state in the nation (seventh if the District of Columbia is included in the rankings), moving up two places since 2010 in its census diversity ranking. 
*  ​New census data details New Jersey’s growing diversity, NewJerseyMonitor, 9/22/2023
​
*  Detailed Races and Ethnicities in the United States and Puerto Rico: 2020 Census, US Census Bureau
--Foreign immigration and national origins

        New Jersey has about 2.3 million immigrants, including about 450,000 who are undocumented, according to federal reports, comprising nearly a quarter of the state's population, higher than the national rate of 14.3%. In recent years, New Jersey has depended on foreign immigration to avoid a net decline in population. It is estimated that there were about 475,000 illegal immigrants making up about 5.2% of the population--the fourth highest percentage of any state. In the 2020 census, 90.3% of the residents in New Jersey were US citizens. 

       The primary sources of foreign immigration to New Jersey have increasingly been shifting from Europe to Latin America and Asia, but the five largest ethnic groups in 2000 continued to reflect the historical pattern, with the largest groups comprised of Italian (17.9%), Irish (15.9%), African (13.6%), German (12.6%) and Polish (6.9%). Just under 32% of New Jersey residents speak a language other than English at home. The Spanish language, with 14.59% of households speaking it as their primary language at home, is by far the most frequent language spoken other than English, with Chinese (1.23%), Italian (1.06%) and Portuguese (1.06%) the only other languages exceeding one percent.
      
        As a percentage of population in 2022, New Jersey was the third highest state in the percentage of Asians with 9.6%,  behind only Hawaii (38.6%) and California (14.6%), and the highest of all states in the percentage of Asian Indians with 3.32%. Bergen County is home to all of the nation's top ten municipalities by percentage of Korean population, led by Palisades Park, where Koreans comprise the majority (52%) of the population. The state also had the largest population of Peruvian Americans of all states; the largest population of Cuban Americans outside of Florida; and the third highest Italian American population by percentage, according to the 2000 Census. 

       Some 31.6% of the households in New Jersey reported speaking a non-English language at home as their primary shared language, which is higher than the national average of 21.5%, with the survey measuring only the primary self-reported language spoken by all members of the household. In 2020, the most common non-English language spoken in households in New Jersey was Spanish. 16.4% of the households in New Jersey reported speaking Spanish at home as the primary shared language between all members living in the household.
      
       According to data from the National Science Foundation, immigrants comprise 48% of state residents with master’s degrees and 41% of those with doctorates in scientific fields.

       New Jersey attitudes toward immigrants appear to be more positive than the nation as a whole. The state provides eligible undocumented residents, including DACA recipients, with access to in-state tuition, state financial aid, professional and occupational licenses, and driver licenses and state identification. Legislation enacted in 2024, after the election of Donald Trump for a second term as president, bars law enforcement officers from stopping, questioning, arresting, searching, or detaining any person based solely on their actual or suspected immigration status and also prohibits law enforcement from sharing immigrant-related resources or databases with federal immigration officials.A survey in 2014 reported that 61% responded that immigrants strengthened the country because of their hard work and talents compared to 55% nationally; similarly, 29% of New Jerseyans responded that immigrants burdened the country because they took jobs, housing and healthcare compared to 36% who so responded for the US as a nation. New Jersey had the same percentage as the US with 60% of respondents who believed that the best option for dealing with illegal immigrants was to provide a way for them to become citizens; 15% of New Jerseyans responded that illegals should be identified and deported compared to 19% in all states. 

​*  State Immigration Data Profiles, New Jersey, Migration Policy Institute
*  Estimates of the Unauthorized Immigrant Population Residing in the United States:
January 2015–January 2018, US Department of Homeland Security
 
​*  New Jersey Data Profile, DataUSA.io
*  US unauthorized immigrant population estimates by state 2016, Pew Center
​

-State-to-state migration
      
       According to the United Van Lines annual National Movers Study released in January 2023 tracking state-to-state moves in the prior year, more residents moved out of New Jersey than any other state, as 67% of New Jersey moves were outbound, which is down from the five-year trend of 70%. Vermont saw the highest percentage of inbound migration (77%) for the second consecutive year.  Illinois, New York, Connecticut and California trailed New Jersey in the ranks of highest percentage of outbound movers. The leading inbound states behind Vermont were South Dakota, South Carolina, West Virginia, and Florida.

      The US Census Bureau's annual estimate published in January 2025 reported that New Jersey had a net loss of 35,554 as residents left the state for new jobs, lower costs or warmer weather. The three most popular destinations according to Census data were Pennsylvania, New York and Florida.
*  Annual National Movers Study 2022, United Van Lines
*  Statistics of Income, Migration Data 1990-2011, Internal Revenue Service

--Age
        
       In 2020, the median age of all people in New Jersey was 40. Native-born citizens, with a median age of 37, were generally younger than foreign-born citizens, with a median age of 46. With 17% of its total population aged 65 or over, the state ranked 30th of all states in its older population. 41st oldest of the states behind Utah, the youngest at 29.7 years, and ahead of Maine, the oldest at 42.7 years. The state had an estimated 14.7% of its population 65 years or older as of 2014 compared to the national average of 14.5% according to the Census Bureau. Some 40% of the state's 18 to 34 year-olds live with their parents, a proportion well above the national average of 30%.
*  New Jersey Population, US Census Bureau

--Counties
 

​       Bergen County had the largest population in the state as reported in the 2020 Census with 955,732 residents and Salem was the least populated with 64,837 residents. Large increases in urban areas and Ocean County were somewhat offset by population in losses in outlying counties. The four southernmost counties--Atlantic, Cape May, Cumberland and Salem--and northernmost Sussex County all lost population. Sussex County's population decrease by 5,044 to 144,221, or by 3.4%, was the biggest loss in the state.


--Cities
 
    
      Only four cities in New Jersey have  a population over 100,000 people. According to the 2020 Census, Newark is the largest in population at 311,549, ahead of second-largest Jersey City with a population of 292,449. Both cities grew substantially from 2010: Newark by 12.4% and Jersey City by 18.1%. Newark remains, however, substantially below its historic population peak reached in 1930 of 442,000. Lakewood Township, in Ocean County, had the most rapid growth of large cities from 2010 to 2020 with a 45.6% gain, reaching 135,518 people to overtake Edison and Woodbridge to become the fifth largest municipality after Paterson and Elizabeth.
​
--Religion

       New Jersey's religious composition was 67% Christian; 14% non-Christian; and 18% unaffiliated (atheist; agnostic; nothing or don't know), according to the 2021 Religious Landscape Study of the Pew Research Center. Overall, about 60% of the state's population in the survey expressed that they were "absolutely certain": in their belief in God and about 10% indicated they had no belief or were uncertain.

         Among Christians, 34% are Catholic and the overall the state has the highest proportion of Catholics at 38%, second only to Rhode Island's 44%, according to the American Values Atlas.  The New Jersey Jewish population of 545,450 is about 6.1% of its 2017 estimated population (second highest after the 8.9% of New York state). It has the second largest percentage of Muslims in its population of 2%  (after Michigan). With 109 mosques in 2011, it tied with Illinois for the fifth highest number of all states, behind first-ranking New York with 257. The city of Paterson was estimated to have 25,000 to 30,000 Muslims as of 2011.
​*  Religious Landscape Study-New Jersey, Pew Research Center
*  US Religion Census 2020, Public Religion Research Institute
*  Jewish Virtual Library
*  Religious Landscape Study, Pew Research Center

​Religious composition of adults in New Jersey
  • Christian....67%
  •     Evangelical Protestant....13%
  •     Mainline Protestant....12%
  •     Historically Black Protestant....6%
  •     Catholic....34%
  •     Mormon....1%
  •     Orthodox Christian....1%
  •     Jehovah's Witness....1%
  •     Other Christian....< 1%
  • Non-Christian Faiths....14%
  •     Jewish....6%
  •     Muslim....3%
  •     Buddhist....< 1%
  •     Hindu....3%
  • Other World Religions....1%
  • Other Faiths....1%
  • Unaffiliated (religious "nones")....18%
  • Atheist....2%
  • Agnostic....3%
  • Nothing in particular....12%
  • Don't know....1%

-- Marriage and divorce

       Some 53% of males and 48% of females aged 15 and older in New Jersey were married compared to, respectively, 52% and 48% nationally, according to a survey taken by the US Census Bureau. The median age at first marriage in New Jersey was 30 years old for men--tied for highest of all states--and 28 years for women, compared to the US average of 28 years for men and 26 for women. Those currently divorced at the time of the survey comprised 7% of men and 10% of women compared to 9% and 12%, respectively, for all states.
*  Marriage and Divorce, National Center for Health Statistics/Centers for Disease Control
*  The States of Marriage and Divorce, Pew Research Center

--Projections

        By 2045, the state's total population is projected to be just over 10 million residents. The smallest racial groups in the state, Native Americans, Pacific Islanders and Multiracial populations, are projected to increase substantially, growing by 167% between 2010 and 2030. By 2025, it is projected that non-Hispanic whites will no longer be a majority of New Jersey's population, accounting for just 49.4% of the total population by then.
​*  Population Projections, US Census Bureau
*  US Population Projections Interactive Map, WeldonCooperCenter.org

​-- Quality of life

       
In April 2022, the Monmouth University Polling Institute released its periodic survey of how New Jerseyans rate the state as a place to live. A little under two in three New Jerseyans said the state is either an excellent (19%) or good (45%) place to live, while 22% responded that it is only fair and 13% rate the state as poor. The current positive rating of 64% was between the previous year’s 59% result and 68% in 2020. The all-time high mark for the state rating was 84% positive in February 1987. The record low was 50% in February 2019, but it improved to 61% by September of that year.

      While the overall state rating has improved in the survey, a larger than ever number of New Jerseyans (59%) said they would like to move out of the state at some point.  Prior polls that asked this question between 2007 and 2014 found from 49% to 53% who wanted to leave. 
​*  Monmouth University Polling Institute


-- People
*
Estimated Population December 2024- 9,500,851
* Population 2020 Census-  9,288,994
* Population 2010 Census-   8,791,894
* Population % change 2010 to 2020-  5.7%
* Persons 18 years and over % 2020-  78.4% 
* Persons under 5 years in age % 2020- 5.8%
* Net change persons moving in or to other states 2024 (United Van Lines/U-Haul)-  out-of-state departures 51.9% inbound: 48.1%;
*  Foreign-born individuals 2018- 23% of total population 
* White alone % 2020-  55%    
* Black or African American alone % 2020-  13.1% 
* Hispanic or Latino (of any race) % 2020-   21.6%   
* Asian alone % 2020-  10.2%  
* Undocumented immigrants 2023 estimate-  428,000 
* Persons per square mile 2020-    1,195.5 ​
*  Marriage Rate    5.1 (marriages per 1,000
*  Divorce Rate    2.3 (divorces per 1,000

*  US Census Bureau
​*  American Fact Finder, US Census Bureau

*  National Movers Study 2021, United Van Lines
​